
Hello everyone. Today we are going to discuss “Selenium IDE”, which is one of the tools in Selenium suite. And we will see how “Selenium IDE” can solve our automation problems and how it can give us better solutions and we will also see what are the advantages as well as the disadvantages of “Selenium IDE”.
So in case you have any questions, please feel free to type your query in the comment section below and I will try my best to answer them as soon as possible.
So we are going to learn:
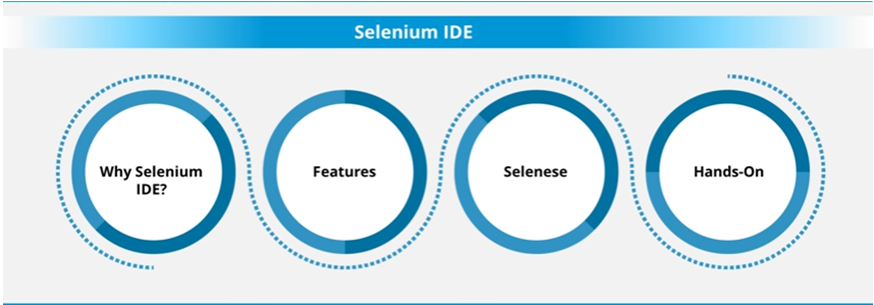
1. Why Selenium IDE
2. What features it provides us?
3. Selenese – The language in which Selenium scripts are written.
4. Hands – on

Million dollar question arises, as to when there are so many tools available in the market, why to choose Selenium IDE?
There are a couple of things which you consider while selecting an Automation tool.
You don’t have much programming expertise but you still want to create automation scripts. In case you are a beginner, you would want an easy to use tool which you can learn the fastest without much programming expertise or if there are some boring repetitive tasks which you quickly wanted to automate. Here comes Selenium IDE which has a simple GUI and you can record your actions and we can playback those actions on the application.

Selenium IDE stands for Integrated Development environment.
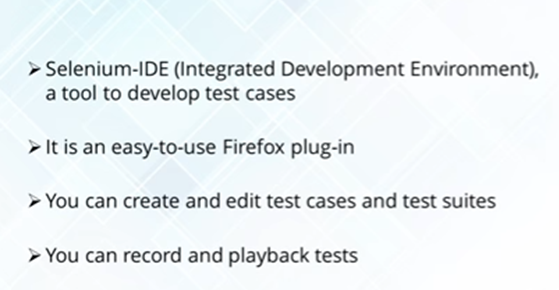
It is a Firefox plug-in which can create tests very quickly through record and playback which is quite similar to how we do the recording in UFT. Initially, there was a limitation that it can work only on Firefox browser but now it supports chrome also and hence it can be used for cross-browser testing.

Selenium is an open source tool without any dedicated support but there are communities wherein people who have questions can post in and experts all over the globe can answer those.
We will welcome the new Selenium IDE with all new looks. Now we can have parallel execution in Selenium IDE. We can execute our test cases in parallel. In fact, there are many more changes which are expected to come.
However, we won’t recommend users to go with Selenium IDE for their framework designing but it can be used as a prototyping tool.
You can download & install the latest Selenium IDE using this link.
The all-new Selenium IDE looks like this:
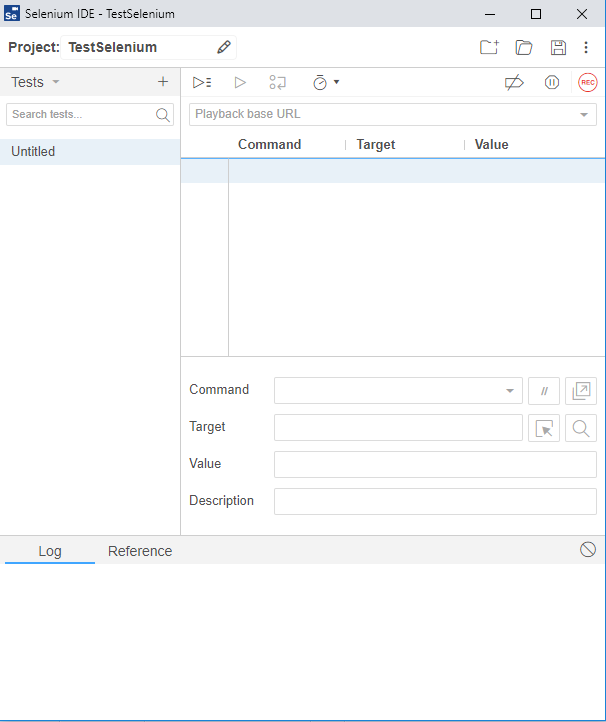
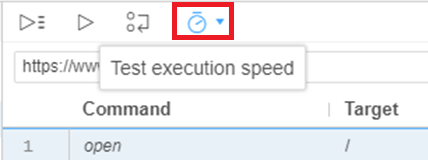
Toolbar – It has various options to control your test cases and speed execution.
Run All – If you have multiple test cases, you can execute them one after the other.
Run – It runs the currently selected test case.
Pause – It allows you to wait or pause the execution of a particular test case and then continue running it by clicking the Pause button again. This button will only be available when a test case is running. If you click on the Pause button the resume button is activated to continue running the test case.
Speed control controls the speed of your execution of test cases. It’s actually a slider which runs from fast to slow. So if you will slide from top to bottom, the execution speed will reduce.
Let’s do a quick hands-on to the all-new Selenium IDE. We will use Selenium IDE in the Chrome browser.
Open the Chrome browser and click on Selenium IDE to launch.
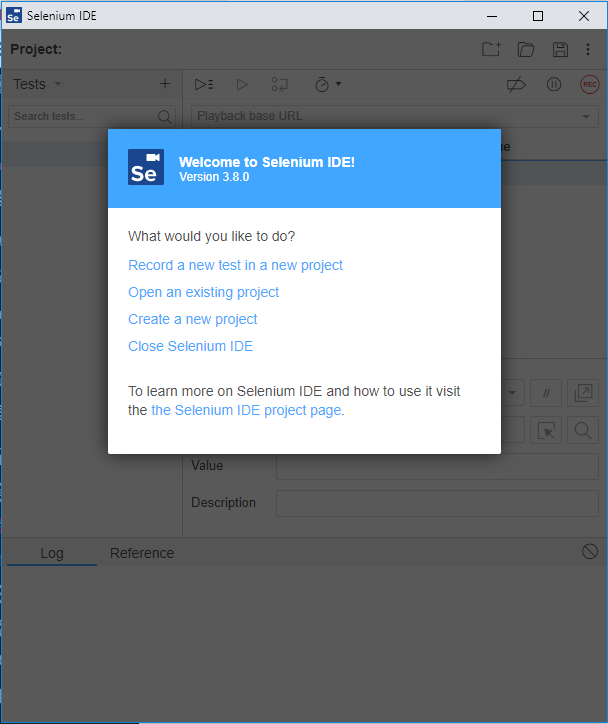
Click on the Record a new test in a new project. Then it will ask to provide the name of the project as shown below.
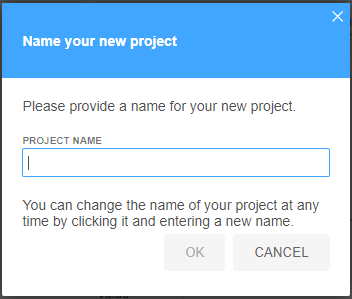
Provide the name as TestProject and click on the OK button to continue.
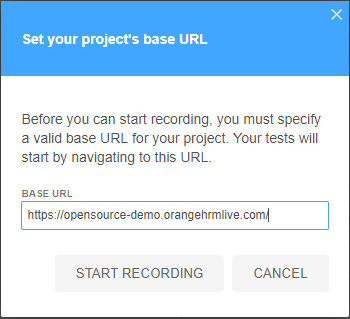
Now we need to provide the Base URL. Let’s provide the Base URL as https://opensource-demo.orangehrmlive.com/ and click on Start Recording.
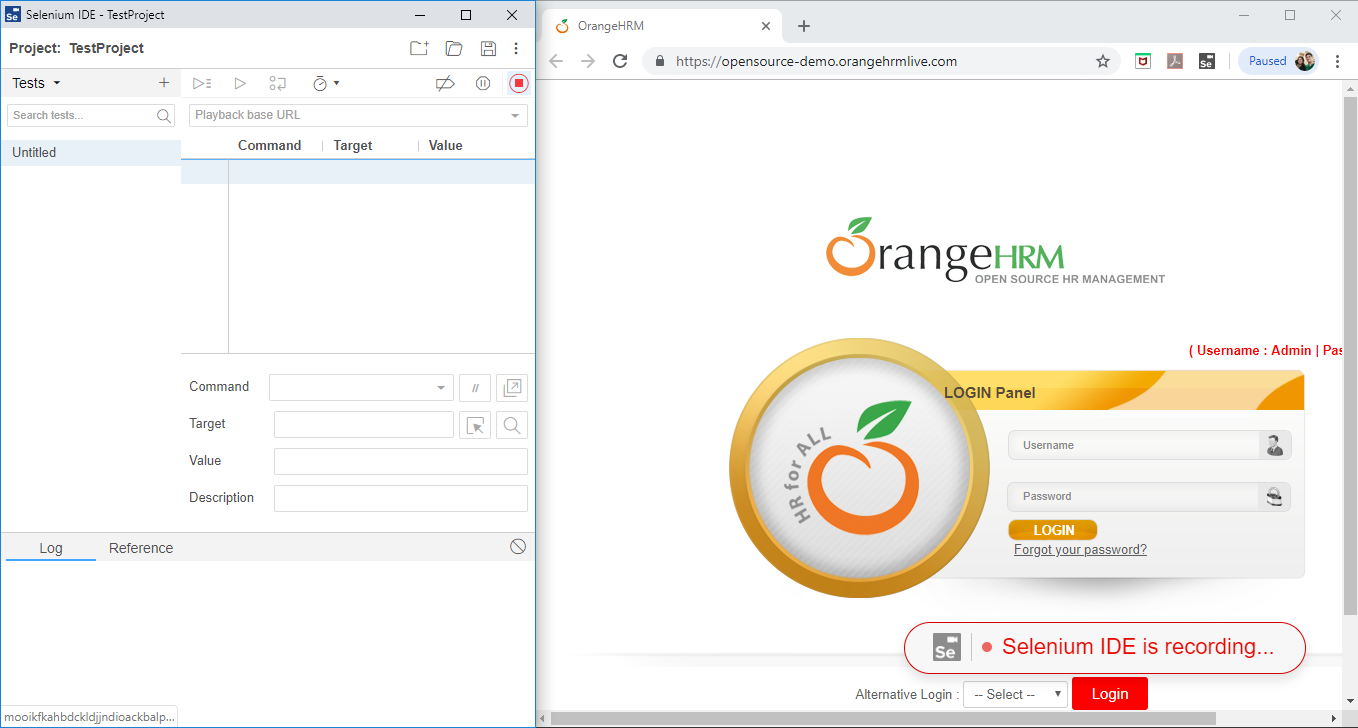
You will see that the URL would be opened in Chrome and on the bottom, Selenium IDE has started recoding.
A new feature in Selenium IDE that has just come up is that if we right-click on any element on the screen while the recording is set to ON, there is an option to add the commands from the right-click menu itself.
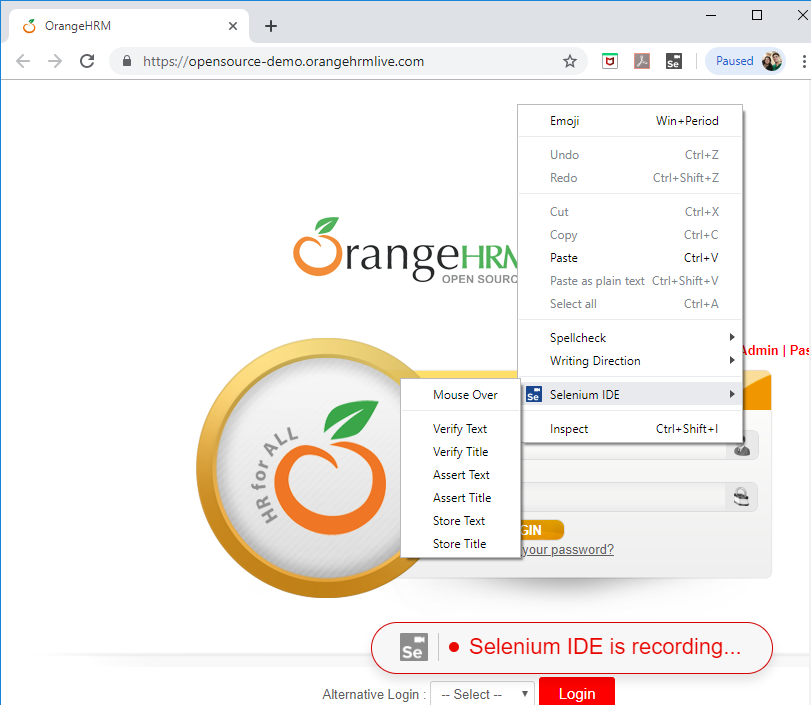
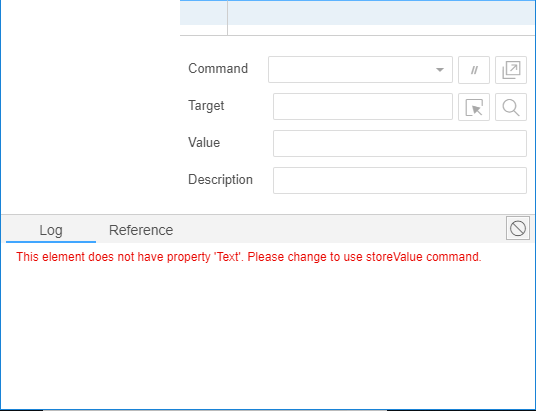
Right click on the Login field, click Selenium IDE -> Verify Text. Now, this field does not support this property so it will be shown in the IDE as below.
Provide the Username and password as “Admin” & “admin123”. Note that password is in lower case. Click on the Login button and we will be able to login inside the application.
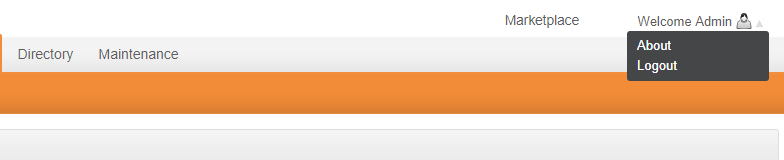
Click on the Welcome Admin link on the top right followed by Logout to log out from the application.
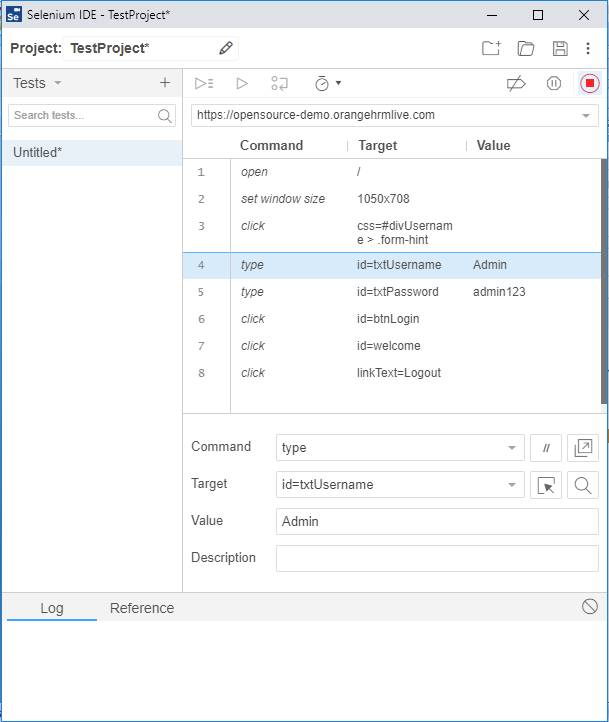
Now shift the focus back to Selenium IDE and you will see all the recorded steps one after the other.

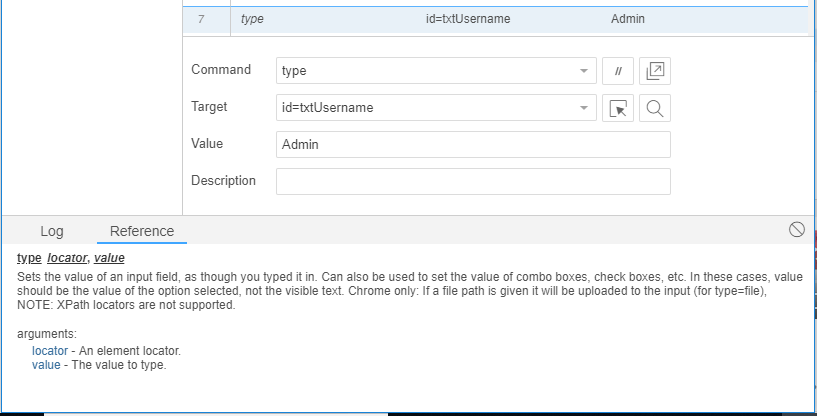
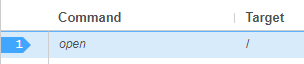
You can click any of the steps inside the IDE and the respective Command & Target & Value will be displayed. For example, click on 4th line inside the editor.
Click on the down arrow on the Target section. You will see that Selenium has captured many other locators for UserName field which will be displayed in the dropdown as:
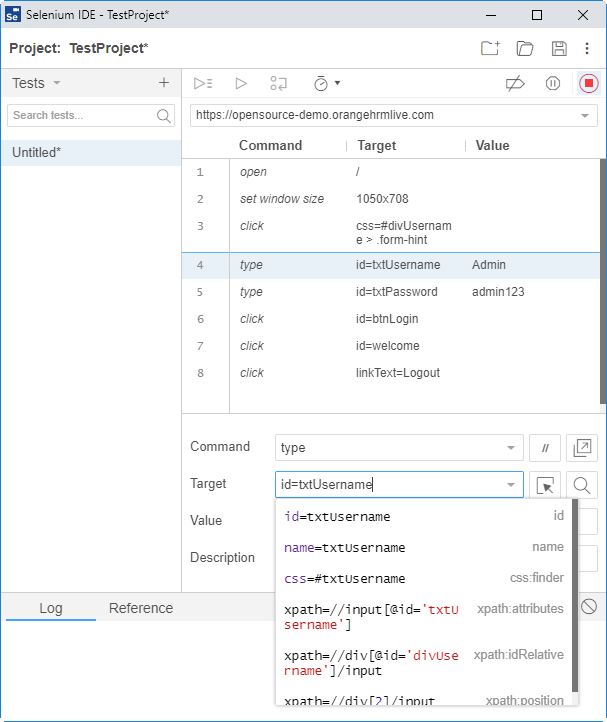
In case the primary locator which is id in this case, if it does not work, it can search using other locators. People who have worked extensively on Selenium know that sometimes one locator works in one Browser but does not work in another browser which was a nightmare situation. Selenium IDE is wonderful that it handles this issue very well.
Click on the Reference and you can see the information here as shown below:
We can edit and add new commands by right-clicking anywhere any line:

We can also manually add the steps by typing the proper command. Now Click on Stop Recording by clicking on the red button at the top right side of the IDE. You will see the following dialog box:
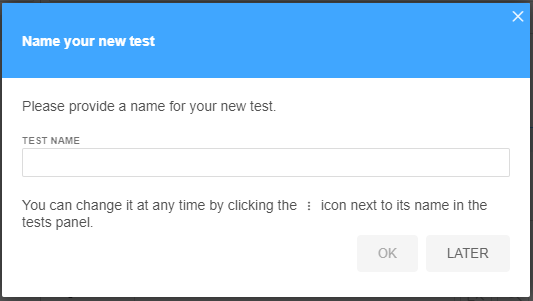
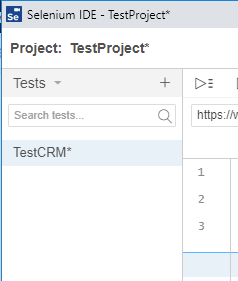
Provide the name as TestCRM and click on the OK button. The test name will be displayed.
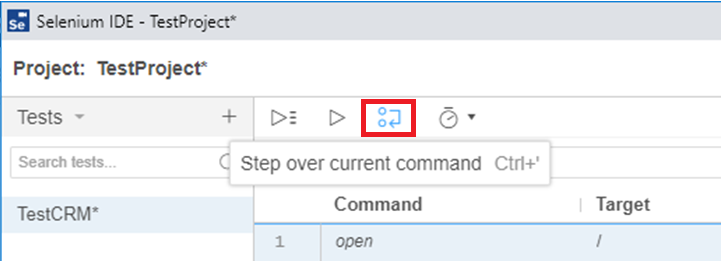
Now select a step and you will see the option Step over current command. It is quite useful during debugging.
Then we can set the execution speed by the option:
By default, it is set to Fast as seen below.
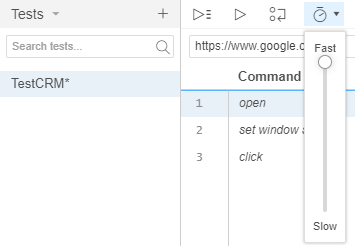
You can always change the Speed by dragging down the slider in case of a slow network or any issues in the execution of scripts.
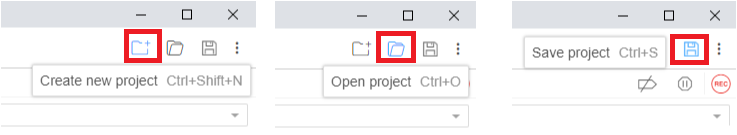
Now we have options to Create a new Project, Open Project & save a Project as shown below:
Click on Save project and you will see the following dialog box:
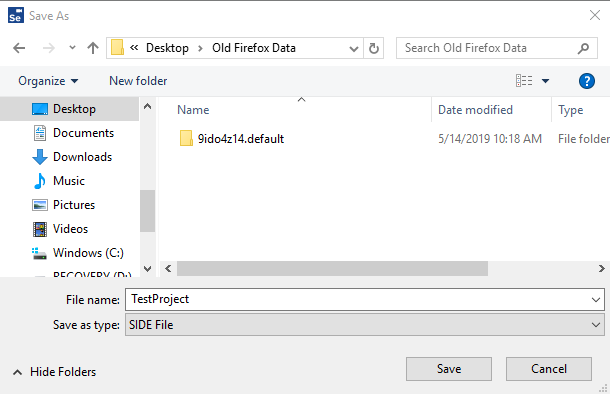
Notice that it will be saved as SIDE file.
Now we can add as many breakpoints in the script as we want by clicking on the number just before the step.
Now once we will run this script, it will be paused at the breakpoints one by one and then we can use the option “Step over current command” for debugging purposes.
Now there is an option Pause on exceptions which is very useful again in debugging.
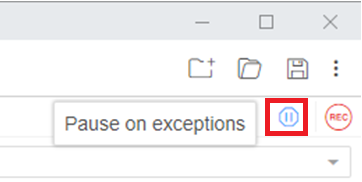
In the case of any exceptions, your script will be paused and you can troubleshoot the problems.
Then there is Log feature which will show all the logs during and after the run session.
Then we can see all Tests, Test Suites and Execution here:
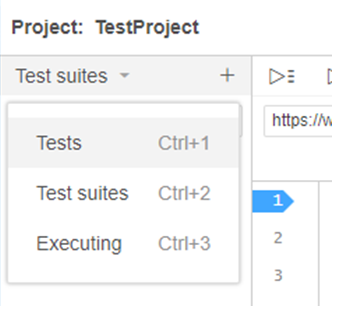
By clicking on the plus button we can add a Test case to a test or a test suite to test suites.
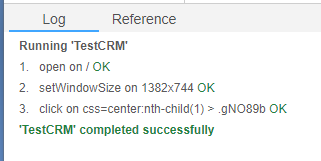
Now click on the Run current test to run the automated test case. Once it is run, you will see:
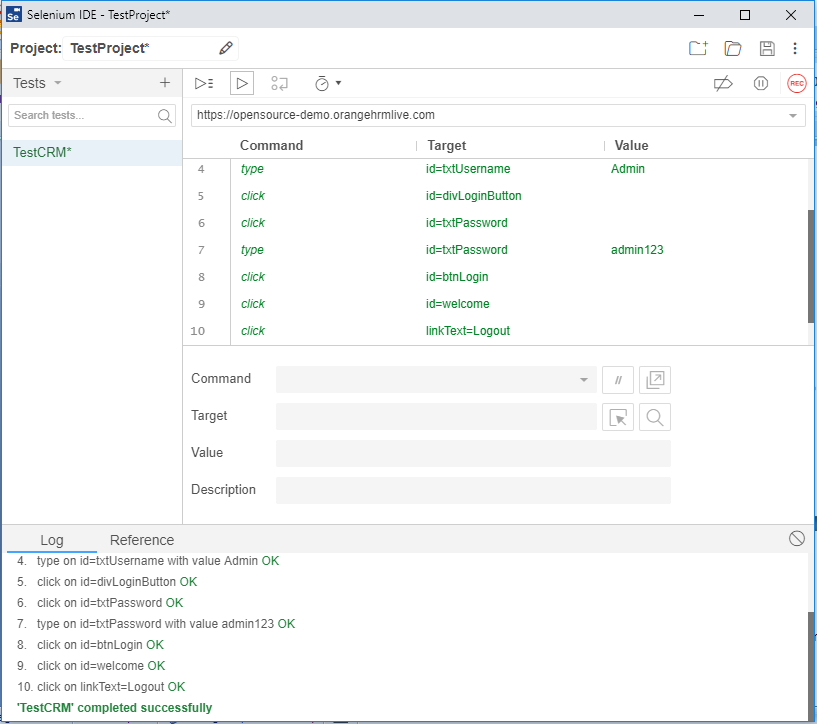
One of the best features of the new Selenium IDE is that implicit waits are automatically added so we need not worry about synchronization which used to be a huge pain in the past.
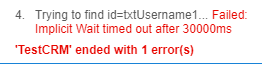
Now let’s do a quick example. Click on the 4th line inside the IDE and change the name to txtUserName1 and let’s see what happens after we re-run the script again.
Click on the three dots at the top right and you will see:
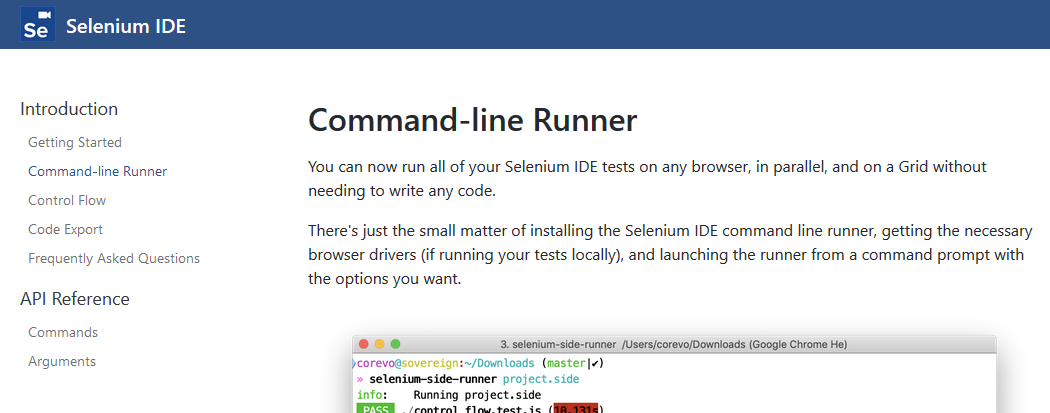
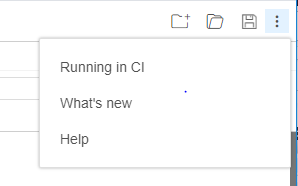 Clicking on Running in CI will open a new URL Command Line Runner which is very useful and we can run all of our Selenium tests on any browser that too in parallel.
Disadvantages of Selenium IDE
Now let’s talk about the limitations or rather things that Selenium IDE cannot do.
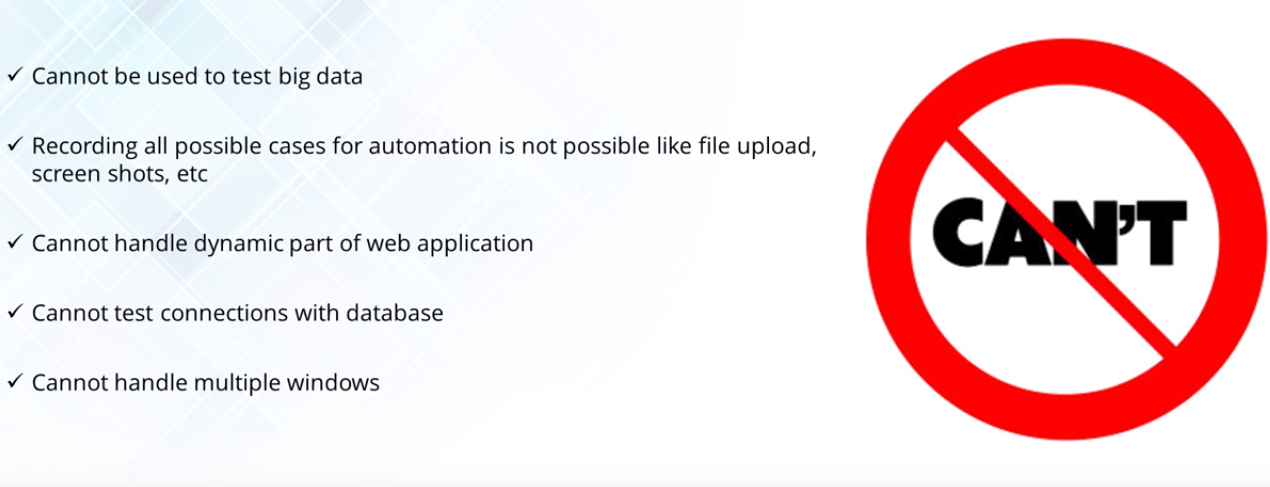
- Selenium IDE cannot be used to do testing with big data.
- Selenium IDE does not go well with dynamic applications. However, it can certainly automate static data.
- Selenium cannot establish a connection with the database.
Selenium IDE Enhancements
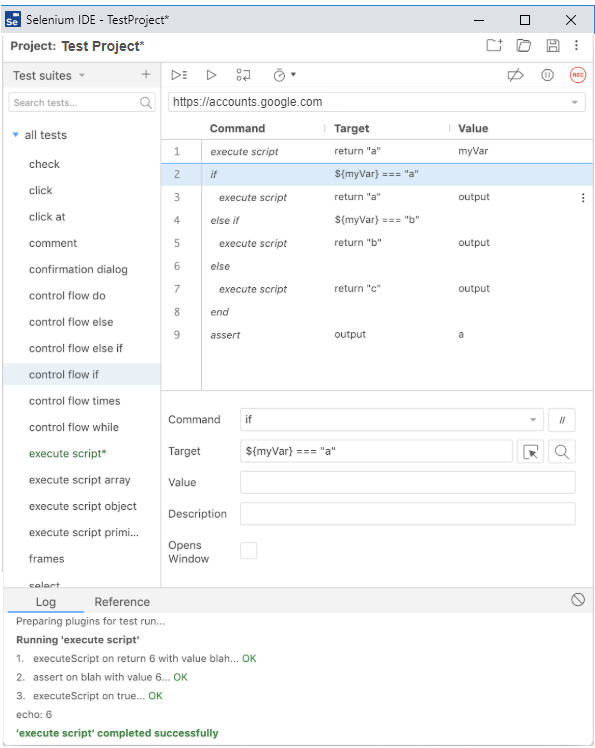
- We can now use conditional logic in your tests. This is how it would look like:
- There is an option of Fallback locators which means now Selenium IDE captures multiple object locators during the recording of the script. During the playback, if the original locator is not able to identify the web element, then it keeps on trying a different locator until it is able to identify the web element. The test will get failed only if none of the locators is able to identify the web element on the page.
- Selenium IDE now supports cross-browser testing as Selenium IDE is now available as Google Chrome browser extension.
- Now Selenium IDE tests can be run on Selenium Webdriver servers. For that, we need to use Selenium IDE Command line(CI) test runner also known as Side Runner. For more details, go to Selenium Command Line Runner. You can consider Side Runner as a merger of Selenium IDE & Selenium Webdriver.
- The all-new Selenium IDE is better in waiting for your application to load. This feature can definitely remove some of the explicit waits.
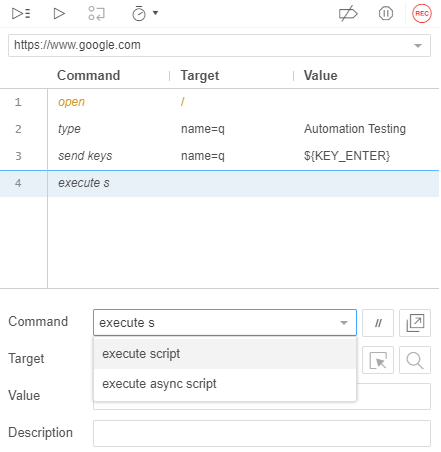
- Selenium IDE now has support for embedded code. Now it supports execute script and execute async script which lets our script call a Javascript code. It has added huge flexibility as now we can use a wide range of Javascript libraries.
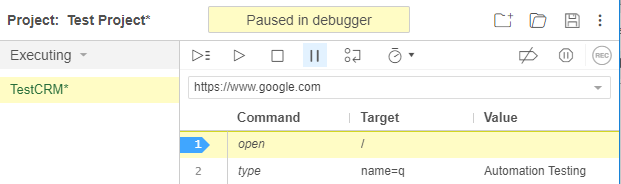
- Selenium IDE now has debugging capabilities. The old Selenium IDE was a big disappointment as it had no Debugger. However, the latest Selenium IDE now supports adding breakpoints and pause the scripts. To add a breakpoint, click on the line number inside the Editor on the left. This is how a paused script will look like:
- Selenium IDE can run scripts in parallel execution. Older Selenium IDE had no such option. We had no other option in previous Selenium IDE other than to use Selenium Grid along with Webdriver to run automation scripts simultaneously.

An expert on R&D, Online Training and Publishing. He is M.Tech. (Honours) and is a part of the STG team since inception.