
ISTQB Agile Tester Extension Exam Theory Study Material Part 8
Have a deep study of this entire question bank containing theory portion with detailed explanation. This study resource is as per the latest syllabus.
Just 1 hr. of time spent in brushing up your knowledge just before the ISTQB Agile Tester Extension Exam shall be of great help in clearing it.
Set of 10 Questions (Q. 71 to 80) with detailed explanation
Q. 71: What are the goals of automated tests in an agile environment?
1) To confirm that the build is functioning and installable.
2) Help to manage the regression risk associated with the frequent change that often occurs in agile projects.
3) Saves time and money.
4) Improves accuracy.
5) Increases in test coverage.
<<<<<< =================== >>>>>>
Q. 72: What are the different options of having “Independent Testing” in an Agile environment?
Independent testers are known to be more effective in finding software defects. However, the following options are possible in the case of Independent Testing of Agile projects.
Option 1: Integrated tester or group of testers in the team:
One or more testers are embedded within the team and are made to work along with programmers and reporting to the Project Manager. In this option, there is a risk of loss of independence and objective evaluation.
Option 2: Separate test teams with testers deputed on-demand and testers reporting to the Project Manager:
The team of testers being outside the development team can have some independence. Testers can provide an objective, unbiased evaluation of the software.
But due to time pressures, lack of understanding of the new features in the product, and relationship issues with business stakeholders and developers this approach is a bit problematic.
Option 3: Complete independence by having a separate test team
The testing team reporting to an independent Testing manager and the services of the testing team can be provided to the Agile team on a long-term basis, right from the beginning of the project, so that both the teams can develop a good understanding of the product and strong relationships and can maintain operational independence.
The independent test team can have specialized testers to work on activities, like developing automated test tools, carrying out non-functional testing, creating and supporting test environments and data, and carrying out test levels that might not fit well within a sprint (e.g., system integration testing).
The independent test team can have specialists in the business domain like users of the system, specialists in technology like database experts, and specialists in testing like security testers, certification testers, or test automation experts.
<<<<<< =================== >>>>>>
Q. 73: What is the use of a burndown chart?
# Burndown chart is a graphical representation of the amount of work left to be done against the target time allocated for the release or iteration.
# Work which needs to be completed (or backlog) is shown along the Y-axis, and the project time or iteration is shown along the X-axis.
# Agile teams use the burndown charts for tracking the progress of the project all through the entire release and within each iteration.
# Burn down charts can be used in any project requiring measurable progress over time.
# Burn down charts can be used as a progress forecasting tool.
<<<<<< =================== >>>>>>
Q. 74: How burndown charts are prepared and interpreted?
A burndown chart for a completed iteration is shown below.
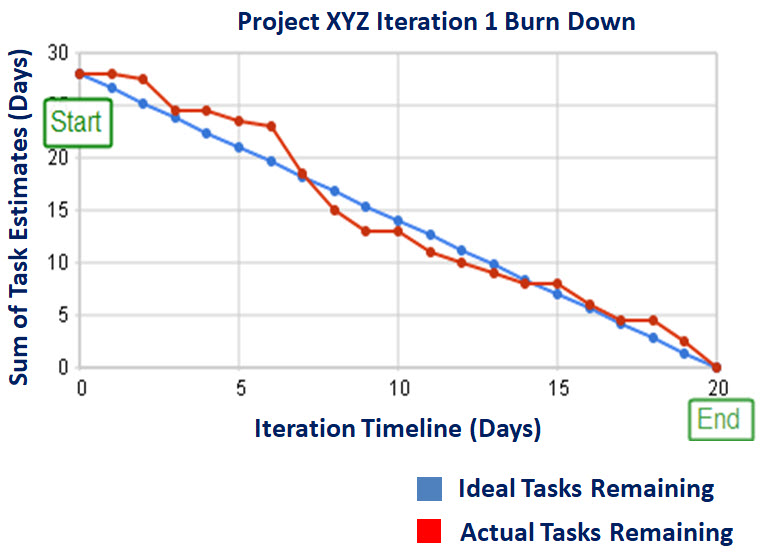
| X-Axis | The project/iteration timeline |
| Y-Axis | The work that needs to be completed for the project. The time or story point estimates for the work remaining will be represented by this axis. |
| Project Start Point | This is the farthest point to the left of the chart and occurs on day 0 of the project/iteration. |
| Project End Point | This is the point that is farthest to the right of the chart and occurs on the predicted last day of the project/iteration |
| Number of Workers and Efficiency Factor | In the above example, there are an estimated 28 days of work to be done, and there are two developers working on the project, who work at an efficiency of 70%. Therefore, the work should be completed in (28 ÷ 2) ÷ 0.7 = 20 days. |
| Ideal Work Remaining Line | This is a straight line that connects the start point to the endpoint. At the start point, the ideal line shows the sum of the estimates for all the tasks (work) that needs to be completed. At the endpoint, the ideal line intercepts the x-axis showing that there is no work left to be completed. Some people take issue with calling this an “ideal” line, as it’s not generally true that the goal is to follow this line. This line is a mathematical calculation based on estimates, and the estimates are more likely to be in error than the work. The goal of a burndown chart is to display the progress toward completion and give an estimate on the likelihood of timely completion. |
| Actual Work Remaining Line | This shows the actual work remaining. At the start point, the actual work remaining is the same as the ideal work remaining but as time progresses, the actual work line fluctuates above and below the ideal line depending on this disparity between estimates and how effective the team is. In general, a new point is added to this line each day of the project. Each day, the sum of the time or story point estimates for work that was recently completed is subtracted from the last point in the line to determine the next point. |
Measuring performance
| Actual Work Line is above the Ideal Work Line | If the actual work line is above the ideal work line, it means that there is more work left than originally predicted and the project is behind schedule. |
| Actual Work Line is below the Ideal Work Line | If the actual work line is below the ideal work line, it means that there is less work left than originally predicted and the project is ahead of schedule. |
<<<<<< =================== >>>>>>
Q. 75: How project managers remove the variability in time estimates in burn down charts?
# One problem with burndown charts is that the Actual Work line appearing above or below the Ideal Work line is dependent on the accuracy of the original time estimates.
# If the team has overestimated the time requirements, the progress will always appear ahead of schedule.
# And if the team has underestimated the time requirements, the project will always appear behind schedule.
# This issue can be tackled by introducing an efficiency factor into the burndown chart.
# After the initial iteration, the efficiency factor can be modified for getting more accurate work output estimates during the next iteration.
<<<<<< =================== >>>>>>
Q. 76: What are the strengths and weaknesses of burndown charts?
Strengths of the burndown chart are:
1) Burndown charts are quite simple, easy-to-follow graphical representations
2) They clearly show the achievements of the Agile team
3) They clearly indicate as to what the team still needs to achieve
4) They predict if the team is on target within the planned timelines
5) They alert the team to potentially problematic situations quickly
6) They predict stagnation of the project
7) They indicate areas needing more focus to get back on the track
8) They provide motivation to the team
9) They predict where the team has succeeded and indicated the pending work
Weaknesses of the burndown chart are:
1) They have limitations in the sense they show only part of the total picture
2) They do not show the tasks still in progress
3) They do not show how close the team is towards the completion of the work
4) They can create exaggerated expectations
<<<<<< =================== >>>>>>
Q. 77: What is the use of Agile task boards?
# Agile task boards are used by the Agile teams to provide an instant, detailed visual representation of the whole team’s current status, including the status of testing.
# The story cards, development tasks, test tasks, and other tasks created during iteration planning are displayed on the task board. Generally, color-coordinated cards are used to indicate the task type.
# During the iteration, progress is managed via the movement of these tasks across the task board into columns such as to do, work in progress, verify, and done.
# Agile teams may use tools to maintain their story cards and Agile task boards, which can automate dashboards and status updates.
<<<<<< =================== >>>>>>
Q. 78: What is the objective of stand-up meetings?
During stand-up meetings, the team members share the current status of the work at hand.
The agenda for each member is:
1) What have you completed since the last meeting?
2) What do you plan to complete by the next meeting?
3) What is getting in your way?
Any issues that may block test progress are communicated during the daily stand-up meetings, so the whole team is aware of the issues and can resolve them accordingly.
The daily stand-up meeting includes all members of the Agile team including testers.
<<<<<< =================== >>>>>>
Q. 79: How Agile teams capture the customer satisfaction feedback?
To improve the product quality, customer satisfaction surveys are conducted to get feedback on whether the product meets customer expectations.
Following metrics are used for decision making to determine the customer satisfaction;
1) Test pass/fail rates,
2) Defect discovery rates,
3) Confirmation and regression test results,
4) Defect density,
5) Defects found and fixed,
6) Requirements coverage,
7) Risk coverage,
8) Code coverage,
9) Code churn to improve the product quality.
Metrics are never used to reward, punish, or isolate any team members.
<<<<<< =================== >>>>>>
Q. 80: What is code churn?
Code churn refers to lines of code added, modified, or deleted from one version to another during the software development process.
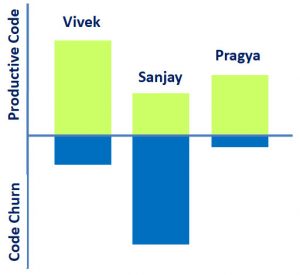
When all of a sudden the code churn becomes higher than expected, it is a clear sign that something is wrong somewhere in the working of the team.
If code churn is detected during the early stages of the project, its diagnosis and timely corrective action with the concerned people becomes possible.
ISTQB Agile Tester Extension Exam Theory Study Material Part 9

An expert on R&D, Online Training and Publishing. He is M.Tech. (Honours) and is a part of the STG team since inception.