HP LoadRunner 11.X Certification Exam Skill Test Q. 171 to 180
Newly Added Set of Questions helpful in HP LoadRunner 11.x Certification Exam code HPO M48
Objective Type / Multiple Choice Questions on HP LoadRunner 11.X under the Series
(Quickly Review Your LoadRunner Skills before appearing for HP Certification Exam HPO M48)
Set of 10 Questions
Correct Answers to Earlier Questions – Q. 161 to Q 170 are at the end of the page:
Q. 171: What are available Diagnostics graphs? (Select two.)
A. Siebel
B. Firewall
C. Running Vuser
D. SiteScope
E. J2EE &.NET
<<<<<< =================== >>>>>>
Q. 172: Which Analysis graph shows the number of transactions against transaction response times?
A. Average Transaction Response Time
B. Transactions per Second
C. Transaction Response Time Under Load
D. Transaction Response Time (distribution)
<<<<<< =================== >>>>>>
Q. 173: Which Analysis graph identifies web pages that take the most time; isolates where time is spent; and helps in identifying DNS resolution, SSL, and connection issues?
A. Network Delay Time
B. Windows Resource
C. Time to First Buffer Breakdown
D. Page Download Time Breakdown
<<<<<< =================== >>>>>>
Q. 174: Which option in the Analysis tool allows you to focus on a specific measurement within your graph? (Select two.)
A. Apply Filter
B. Merge Graphs
C. Auto Correlate
D. Select Measure
E. Drill Down
<<<<<< =================== >>>>>>
Q. 175: What is the purpose of the Auto Correlate function?
A. To merge results from two load test scenarios
B. To autodiscover and document all bottlenecks detected during a performance test
C. To detect similar trends among measurements by correlating a measurement in one graph with easurements in other graphs
D. To autogenerate reports correlated to a recipient’s level of knowledge
<<<<<< =================== >>>>>>
Q. 176: Which filtering condition will be used to highlight only failed transactions in Analysis graphs?
A. Transaction end status
B. Host name
C. Transaction name
D. Error type
<<<<<< =================== >>>>>>
Q. 177: Which Merged graphs are provided by Analysis? (Select three.)
A. Overlay
B. Cross scenario
C. Correlate
D. Tile
E. Response Time Under Load F. SLA analysis
<<<<<< =================== >>>>>>
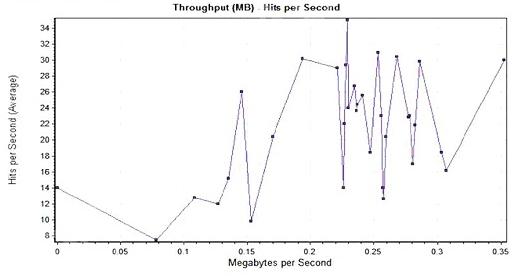
Q. 178: Click the Exhibit Button

Which Merge graphs Function was used to create the graph shown in the exhibit?
A. Corelate
B. Tile
C. Overlay
D. Cross Scenario
<<<<<< =================== >>>>>>
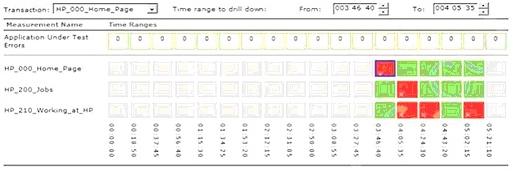
Q. 179: Click the Exhibit Button

What does the image shown in the exhibit represent?
A. Service Level Agreement
B. Transaction Performance Summary
C. Transaction Response Time (Distribution)
D. Auto Corelation
<<<<<< =================== >>>>>>
Q. 180: Which Analysis feature under Options is useful to limit the analysis to only a portion of the entire load test duration?
A. General: Date format
B. Analyze Transaction Settings: Errors
C. Result Collection: Data Time Range
D. Result Collection: Data Aggregation
Read the Correct Answer of the above Questions
Access the Full Database of All Questions
Correct Answers to Earlier Questions – Q.161 to Q 170 are as under:
| Question No. | Correct Answer |
| Q. 161 | A |
| Q. 162 | C |
| Q. 163 | C |
| Q. 164 | C |
| Q. 165 | D |
| Q. 166 | A |
| Q. 167 | D |
| Q. 168 | A,C |
| Q. 169 | D |
| Q. 170 | B |

An expert on R&D, Online Training and Publishing. He is M.Tech. (Honours) and is a part of the STG team since inception.
