Cause-Effect Graphing-Black Box Software Testing Technique
This is basically a hardware testing technique adapted to software testing. It considers only the desired external behaviour of a system. This is a testing technique that aids in selecting test cases that logically relate Causes (inputs) to Effects (outputs) to produce test cases.
A �Cause� represents a distinct input condition that brings about an internal change in the system. An �Effect� represents an output condition, a system transformation or a state resulting from a combination of causes.
According to Myer Cause & Effect Graphing is done through the following steps:
Step – 1: For a module, identify the input conditions (causes) and actions (effect).
Step – 2: Develop a cause-effect graph.
Step – 3: Transform cause-effect graph into a decision table.
Step – 4: Convert decision table rules to test cases. Each column of the decision table represents a test case.
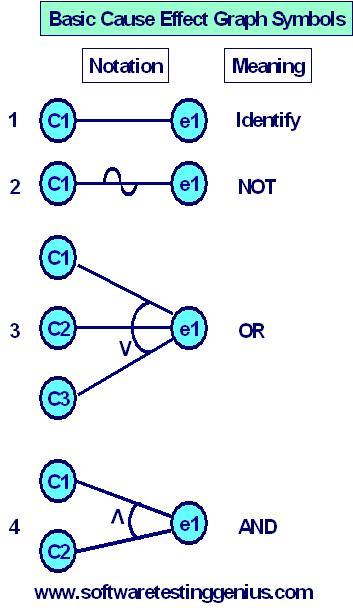
Basic symbols used in Cause-effect graphs are as under:

Consider each node as having the value 0 or 1 where 0 represents the ‘absent state’ and 1 represents the’present state’. Then the identity function states that if c1 is 1, e1 is 1 or we can say if c0 is 0, e0 is 0.
The NOT function states that if C1 is 1, e1 is 0 and vice-versa. Similarly, OR function states that if C1 or C2 or C3 is 1, e1 is 1 else e1 is 0. The AND function states that if both C, and C2 are 1, e1 is 1; else e1 is 0. The AND and OR functions are allowed to have any number of inputs.
The concept of designing test cases can be illustrated through the example of the �Triangle Problem� covered under White Box Testing �Tutorial � 5: Estimation of Complexity Measure V(G) : For a Triangle�.
Going by the Myer methodology, test cases can be designed for the triangle problem in the following way:
Step – 1: First of all we need to identify the causes and its effects.
The causes designated by letter �C� are as under
C1 : Side �x� is less than sum of �y� and �z�
C2 : Side �y� is less than sum of �x� and �z�
C3 : Side �z� is less then sum of �x� and �y�
C4 : Side �x� is equal to side �y�
C5 : Side �x� is equal to side �z�
C6 : Side �y� is equal to side �z�
The effects designated by letter �e� are as under
e1 : Not a triangle
e2 : Scalene triangle
e3 : Isosceles triangle.
e4 : Equilateral triangle
e5 : Impossible
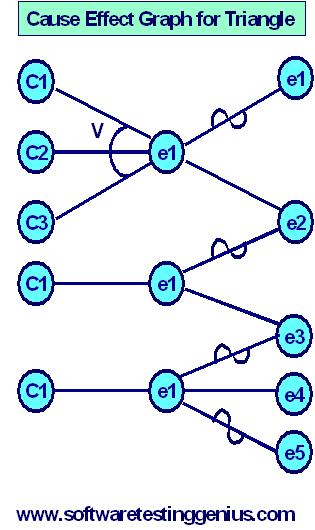
Step – 2: Draw the following cause-effect graph

Step – 3: Transform cause-effect graph into the following decision table

Step – 4: Since there are 11 rules, we get following 11 test cases
| Test Case | x | y | z | Expected Output |
| 1 | 4 | 1 | 2 | Not a triangle |
| 2 | 1 | 4 | 2 | Not a triangle |
| 3 | 1 | 2 | 4 | Not a triangle |
| 4 | 5 | 5 | 5 | Equilateral |
| 5 | ? | ? | ? | Impossible |
| 6 | ? | ? | ? | Impossible |
| 7 | 2 | 2 | 3 | Isosceles |
| 8 | ? | ? | ? | Impossible |
| 9 | 2 | 3 | 2 | Isosceles |
| 10 | 3 | 2 | 2 | Isosceles |
| 11 | 3 | 4 | 5 | Scalene |
Guidelines for Cause-Effect Functional Testing Technique:
1) If the variables refer to physical quantities, domain testing and equivalence class testing are indicated.
2) If the variables are independent, domain testing and equivalence class testing are indicated.
3) If the variables are dependent, decision table testing is indicated.
4) If the single-fault assumption is warranted, boundary value analysis (BVA) and robustness testing are indicated.
5) If the multiple-fault assumption is warranted, worst-case testing, robust worst-case testing and decision table testing are identical.
6) If the program contains significant exception handling, robustness testing and decision table testing are indicated.
7) If the variables refer to logical quantities, equivalence class testing and decision table testing are indicated.
Many More Articles & Tutorials on Black Box Testing

An expert on R&D, Online Training and Publishing. He is M.Tech. (Honours) and is a part of the STG team since inception.

This content is really useful. One can easily understand Cause-Effect graph testing.
I have a doubt. In the or function, if any one of the input(c1,c2,c3)is 1 then the output(e1)can be 1??